


Colliers Report: Bricks-and-mortar retail is necessary
May 9, 2019
Research & Forecast Report
Q1-2019 CHARLESTON | RETAIL
Key Takeaways
- Bricks-and-mortar shops are necessary to enhance online sales and keep up with customers’ omni-channel shopping preferences.
- Rental rate for the remaining shop space availabilities rose considerably to $22.13 per square foot this quarter.
To download the complete report: 2019 Q1 Retail Charleston Report
Bricks-and-mortar retail is necessary
 The general nature of retail has been changing for several years and a new trend bypassing all others is omni-channel retail. Bigcommerce.com generally defines omni-channel retail as multi-channel retailers with both a digital and a physical presence. The recent evolution of retail began several years ago, with Millennials preferring to shop online. Today, retail is evolving further as consumers from all generations are catered to based on their shopping patterns. Omni-channel retailers are successful in their brick-and-mortar shops and their online outlets because they are in tune as their clients’ preferences change. Some consumers prefer to browse products in a store so they are able to touch an item to measure its quality, true sizing or texture. The same consumer may then become a repeat customer through the store’s online channel. Others prefer to have paper goods delivered, yet pick up fresh produce and meat in a grocery store. Still other consumers prefer to order online for curbside pick-up. Whatever the shopping preference may be, bricks-and-mortar stores are a crucial channel contributing to the success of a retailer.
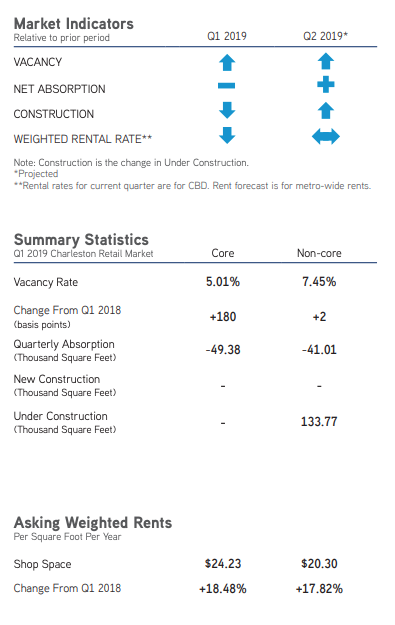
Market Conditions
The Charleston retail market consists of 14.32 million square feet of retail space. The market posted a net negative absorption of 90,387 square feet this quarter, which was almost equally split between core and non-core retail shops. Core shopping centers posted a net negative 49,379 square feet and non-core retail space posted a net negative absorption of 41,008 square feet. The overall market vacancy rate increased from 5.53% during the fourth quarter of last year to 6.17% this quarter. Also, the rental rate for the remaining shop space availabilities rose considerably, to $22.13 per square foot this quarter. There were no new retail buildings delivered to the market during the first quarter of 2019; however, there are currently 133,771 square feet of retail space under construction throughout the Charleston submarkets and another 187,880 square feet proposed to be built.
Berkeley
The Berkeley retail submarket has almost 1.3 million square feet of retail space within its submarket and has relatively equal amounts of core and non-core shopping center spaces. The Berkeley retail market posted a net negative absorption of 10,500 square feet, and the vacancy rate rose from 3.48% during the fourth quarter of 2018 to 4.29% this quarter. The average weighted rental rate increased again this quarter to $13.27 per square foot, meaning higher quality space is now available within the Berkeley submarket.
East Cooper
The East Cooper submarket is the second largest submarket, with 3.41 million square feet of shopping center retail space. The East Cooper retail submarket posted a net negative absorption of 12,089 square feet during the first quarter of 2019. Non-core retail spaces posted a net negative absorption of 15,586 square feet; however, core retail space in the East Cooper submarket absorbed 3,497 square feet. The overall East Cooper submarket vacancy rate increased from 3.23% during the fourth quarter of 2018 to 3.59% this quarter. The overall triple net weighted rental rates in the East Cooper submarket decreased during the first quarter of 2019, averaging $26.06 per square foot. While the non-core rental rates dropped to $24.44 per square foot from $27.27 per square foot last quarter, the core rental rates rose 2.96% over last quarter and were $29.52 per square foot.
North Charleston
North Charleston is the largest submarket, comprised of approximately 3.91 million square feet. The overall North Charleston vacancy rate rose from 8.02% during the fourth quarter of 2018 to 8.95% this quarter because this submarket posted a net negative absorption of 36,302 square feet. Most of the negative absorption occurred in non-core retail space. The triple net average North Charleston shop space rental rates increased considerably during first quarter of this year and averaged $18.69 per square foot. Non-core rental rates rose to $16.33 per square foot, while core retail rates averaged $20.04 per square foot.
 Summerville
The Summerville submarket has over 2.34 million square feet of retail space. During the first quarter of 2019, the Summerville submarket posted a net negative absorption of 3,867 square feet; while there were several non-core centers which posted positive absorption, Collins Square posted a net negative 7,521 square feet, offsetting the positive activity. The Summerville overall vacancy rate rose slightly from 3.28% during the fourth quarter of last year to 3.45% this quarter. The triple net average weighted rental rate in Summerville rose from $21.96 per square foot during the fourth quarter of 2018 to $24.62 per square foot during the first quarter of this year; there are several Summerville core retail shopping centers with rental rates ranging from $30.00 per square foot up to $40.00 per square foot, which brought the entire submarket rental rate average up.
West Ashley
The West Ashley submarket has over 2.21 million square feet of retail space, and the submarket posted a net negative 21,250 square feet of absorption this quarter, mainly due to the core retail space located at Ashley Landing posting a net negative 30,000 square feet on its own. West Ashley non-core retail shops absorbed 9,175 square feet during the first quarter. The overall vacancy rate rose considerably in West Ashley to start off the year; it rose from 9.19% last quarter to 10.15% during the first quarter of 2019. However, due to quality space becoming available within this submarket, the average triple net weighted shop space rental rate was $21.15 per square foot during the first quarter of 2019; core weighted rental rates averaged $30.47 per square foot, while non-core retail spaces weighted rental rates averaged $18.73 per square foot.
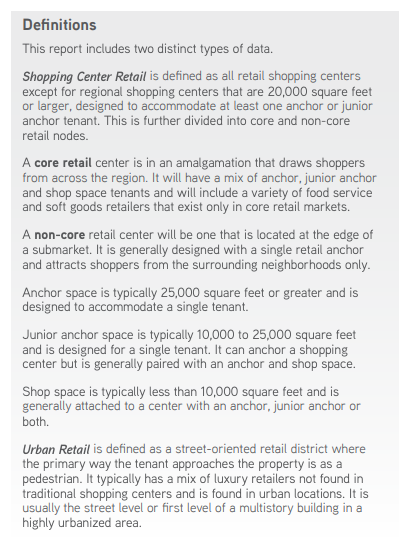
Urban Retail
King Street, stretching from Line Street to Broad Street, consists of approximately 320 properties and 844,058 square feet. In the first quarter of 2019, the vacancy rate remained 9.8%. The average triple net asking rental rate for shop space along the corridor is $58.33 per square foot.
Significant Transactions
According to CoStar, there were 51 retail sales from January through March of 2019, including a two-property portfolio sale totaling approximately $6.9 million. Charleston leasing activity elevated, with 95 leases signed during the first quarter of this year, the largest of which was signed by an undisclosed tenant. There were also leases under 6,000 square feet signed by a bakery, a grocery store and a pizza place, to name a few.
Sales
- For $3.33 million, Grambling Brothers Real Estate purchased a 6,188-square-foot restaurant located at 1407 Shrimp Boat Lane in Mount Pleasant.
- A 56,780-square-foot retail storefront building was purchased for $2.58 million by CC Summerville, LLC.
Leases
- Partners in Primary Care signed a lease for a 8,640-square-foot retail space in North Charleston.
- MIEGS Corporation signed a first floor lease for 8,240-square-foot at 2300 Clements Ferry Road in Charleston.
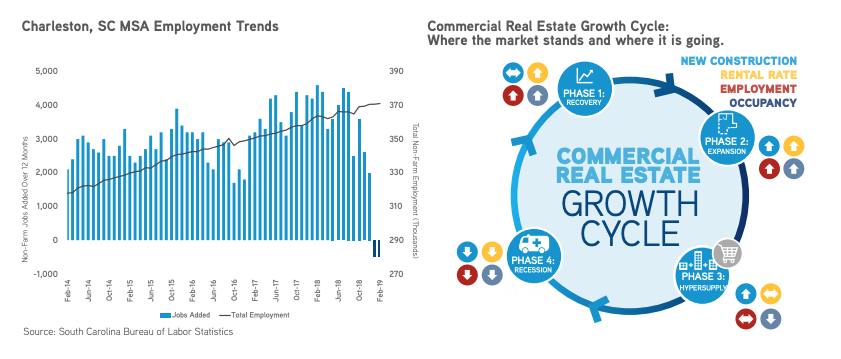
Gross Retail Sales & Employment
Per the Bureau of Labor Statistics’ most recent data from February 2019, non-farm employment reached 371,100 jobs and there were 7,300 new jobs added to the Charleston Metropolitan Statistical Area (MSA) within the last 12 months. Data from the South Carolina Department of Revenue stated gross retail sales in the Charleston MSA reached $30.23 billion, a 10.5% increase over 2018 retail sales total.
Market Forecast
As retailers adapt to trends in consumer demands and discern where best to fit into the market, absorption is predicted to be positive. Absorption will be especially high near dense residential areas where “local” retail thrives and also within urban, walkable retail locations. The construction pipeline is predicted to grow as more residential developments are completed, and demand increases for goods and services that are able to offer both an omni-channel presence. Despite negative absorption this quarter, the Charleston shopping center market vacancy rate is still low, and quality retail space is in short supply; therefore, new construction will likely be proposed. Rental rates are likely to level out until new construction is delivered to the market.
Around South Carolina
Columbia, SC
- Overall absorption in the Columbia retail market was positive; non-core retail is out-performing core retail centers. Submarkets, such as Lexington, with a dense residential population are expected to perform well. Overall shop space weighted rental rates for the remaining available space increased to $15.15 per square foot this quarter.
Greenville-Spartanburg, SC
- Within the Greenville-Spartanburg retail market, non-core retail vacancy rates were lower than last quarter and the sector posted positive absorption. The overall market vacancy rates are expected to drop by mid-year due to very little construction in the retail pipeline. Most of the positive absorption occurred within the non-core submarkets of White Horse Road/Berea, East Spartanburg and the East Side. Overall, urban retail vacancy rates are decreasing and the overall average urban market rental rate is higher due to strong demand to be within walkable urban retail space.
For additional commercial real estate news, check out our market reports here.
To download the complete report: 2019 Q1 Retail Charleston Report


