


First Look at 2020 Census Data
April 28, 2021
On Monday, April 26th some initial data from the 2020 census was released. That data had to be completed to meet legislative deadlines for apportionment.
According to the census.gov website, “apportionment is the process of dividing the 435 memberships, or seats, in the U.S. House of Representatives among the 50 states. At the conclusion of each decennial census, the results are used to calculate the number of seats to which each state is entitled. Each of the 50 states is entitled to a minimum of one seat in the U.S. House of Representatives.
The 2020 Census apportionment population includes the resident population of the 50 states, plus a count of the U.S. military personnel and federal civilian employees living outside the United States (and their dependents living with them) who can be allocated to a home state. The population of the District of Columbia is not included in the apportionment population.”
Since the number of seats in the House of Representatives is fixed at 435 it becomes a zero-sum game with states gaining in population adding a seat and those who show a decline in population lose a seat.
Here’s how the numbers shook out.
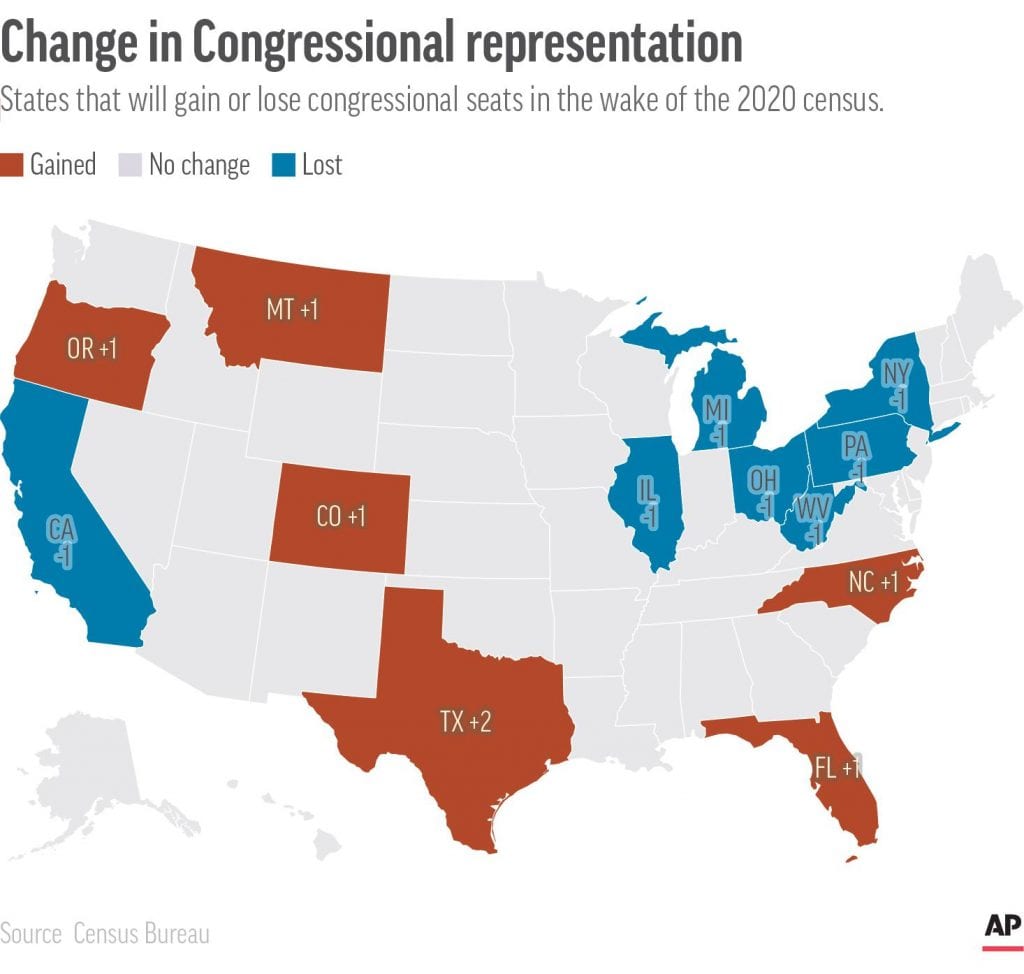
Winners:
- Texas — adding two congressional seats due to 4 million new residents
- Florida – adding one congressional seat due to 2.7 million new residents
- Colorado – adding one congressional seat
- Montana – adding one congressional seat
- Oregon – adding one congressional seat
Losers:
- California – losing one congressional seat
- Illinois – losing one congressional seat
- Michigan – losing one congressional seat
- New York – losing one congressional seat
- Pennsylvania – losing one congressional seat
- West Virginia – losing one congressional seat
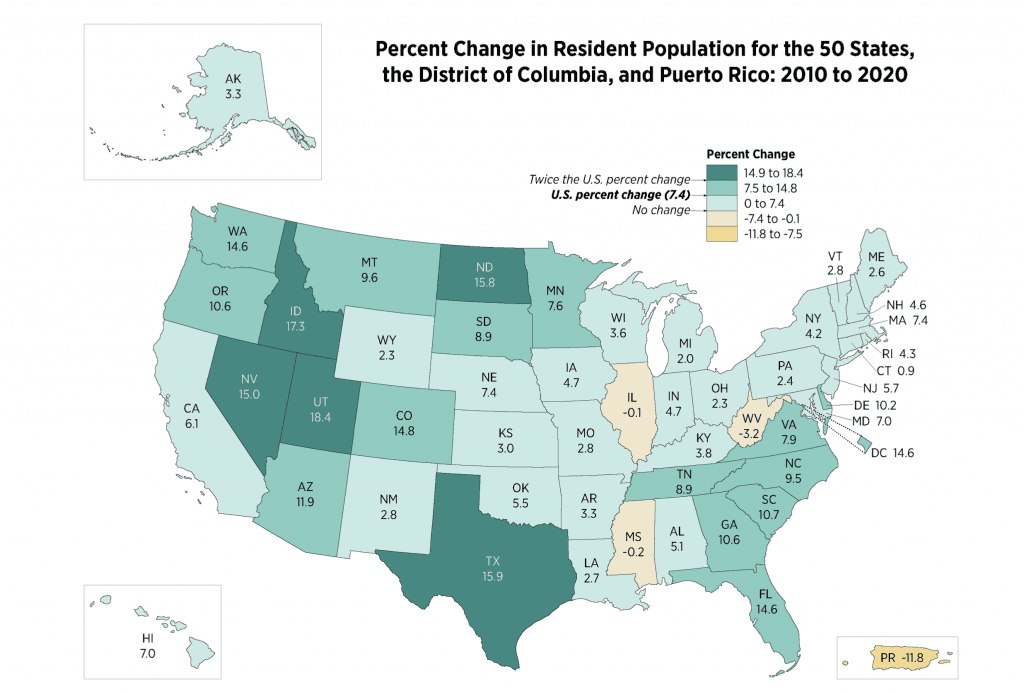
While South Carolina did not gain any congressional seats, it is among the states showing a growth in population. According to the census data, South Carolina increased total population by 10.7 percent from 2010 to 2020. This is an increase of 493,061 people to a new total of 5,118,425.
Here is a map detailing the percentage of growth or loss of population by state.
Detailed data for each state and by county is not expected to be released until August or September.
Stay Tuned.