


Colliers Report: Charleston retailers finding their niche
July 31, 2019Key Takeaways
- New suburban retail construction is expected to deliver before the end of this year.
- A variety of retail trends are transpiring within the Charleston market as retailers attempt to find the right location to better reach and serve their target clients.
For additional commercial real estate news, check out the market reports here.
A variety of retail trends engulf the Charleston market
 Several retail trends are occurring within the Charleston market as retailers attempt to find the proper area to operate to better serve and reach their target clients. Locally-owned restaurants are thriving on the peninsula because of the unique atmosphere they create for the customer experience; as well as the draw created based on their specific cuisines. In addition, most of the new peninsula developments are focused on mixed-use retail.
Meanwhile, chain restaurants are successfully operating within the suburban Charleston submarkets. Trendy bars and craft breweries find success and lower rental rates by locating within northern King Street locations. Big box retail, grocery stores and vacant mall spaces are being absorbed by gyms and furniture stores that can use the large spaces for equipment and showroom space. The tapestry of the Charleston retail market will continue to change as retailers discover their specific niche locations.
Market Conditions
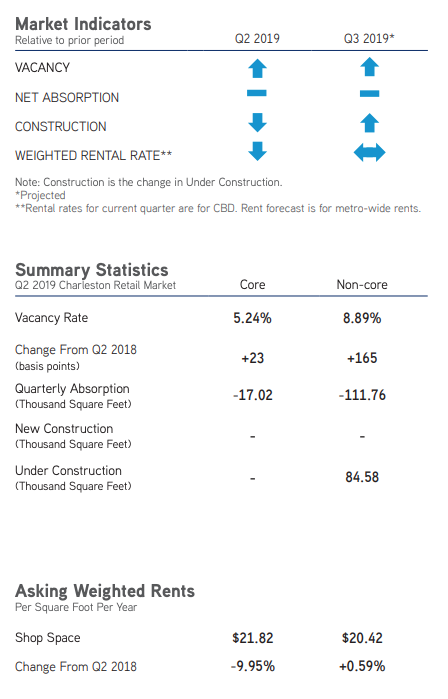
The Charleston retail market consists of 14.32 million square feet of retail space and posted a net negative absorption of 128,781 square feet. The quarterly vacancy rate rose this quarter from 6.07% to 6.97%; core vacancy rate rose from 5.01% to 5.24%, and non-core vacancy rate rose from 7.24% to 8.89%.The rental rate for the remaining shop space availabilities increased from $18.16 per square foot last quarter to $21.00 per square foot during the second quarter of 2019. Retail rental rates in the Peninsula and South Islands rose to $30.00 per square foot and $24.85 per square foot, respectively. There were no new retail buildings delivered to the market during the second quarter of 2019; however, there are currently 84,534 square feet of retail space under construction throughout the Charleston submarkets and another 187,880 square feet proposed to be built.
Berkeley
The Berkeley retail submarket has almost 1.3 million square feet of retail space within its submarket and absorbed 13,030 square feet during the second quarter of 2019. The quarterly vacancy rate dropped from 4.29% to 3.29%; the Berkley submarket non-core vacancy rate was 4.18% while core vacancy rate dropped to 2.48%. The average weighted rental rate increased again this quarter to $14.35 per square foot, meaning higher quality space is available within the Berkeley submarket.
East Cooper
 The East Cooper submarket is the second largest submarket, with 3.41 million square feet of shopping center retail space. The East Cooper retail submarket posted a net negative absorption of 26,948 square feet during the second quarter of 2019. The East Cooper non-core retail posted a net negative absorption of 9,573 square feet and core retail space posted a net negative absorption of 17,375 square feet. The overall East Cooper submarket quarterly vacancy rate increased from 3.17% to 3.97% this quarter. The overall triple net weighted rental rates in the East Cooper submarket decreased during the second quarter of 2019, averaging $24.36 per square foot. This quarter non-core rental rates dropped to $24.06 per square foot, from $24.44 per square foot during the first quarter of 2019; likewise, the core rental rates decreased to $26.00 per square foot for the remaining available retail shops.
North Charleston
North Charleston is the largest submarket, comprised of approximately 3.91 million square feet. The overall North Charleston vacancy rate rose from 8.95% to 9.86% because this submarket posted a net negative absorption of 35,640 square feet. The negative absorption was split relatively evenly between core and non-core retail space. The average triple net North Charleston shop space weighted rental rate decreased during the second quarter of this year and averaged $15.79 per square foot, brought down primarily by low rental rates at Otranto Plaza.
Summerville
The Summerville submarket has over 2.34 million square feet of retail space. During the second quarter of 2019, the Summerville submarket posted a net negative absorption of 5,920 square feet.Core space absorbed 5,323 square feet, while non-core space posted a net negative absorption of 11,245 square feet. The submarket quarterly vacancy rate increased slightly from 3.45% to 3.70%. During the second quarter of 2019, the Summerville submarket posted a net negative absorption of 5,920 square feet. The triple net average weighted rental rate in Summerville decreased from $24.62 per square foot during the first quarter of this year to $24.00 per square foot this quarter; however the core average weighted rental rates range from $15.00 per square foot up to $34.00 per square foot and there are not many availabilities remaining in non-core shop space to use when averaging the Summerville rental rates.
West Ashley
The West Ashley submarket has over 2.21 million square feet of retail space. The submarket absorbed 4,187 square feet this quarter. Ashley Landing absorbed 18,000 square feet this quarter, pushing the non-core absorption up to 1,505 square feet. West Ashley core retail shops absorbed 2,682 square feet during the second quarter of 2019. The positive absorption also pushed the West Ashley overall vacancy rate down to 9.96%. The overall weighted average rental rates are higher than last quarter at $20.70 per square foot; core rental rates range from $27.00 per square foot to $37.50 per square foot.
Urban Retail
King Street, stretching from Line Street to Broad Street, consists of approximately 320 properties and 844,058 square feet. In the second quarter of 2019, the vacancy rate remained relatively the same at 9.4%. The average triple net asking rental rate for shop space along the corridor is $58.33 per square foot.
Significant Transactions
According to CoStar, there were 48 retail sales from April through June of 2019, including a two-property portfolio sale totaling approximately $35.8 million. Charleston leasing activity was strong during the second quarter, there were 68 leases signed — the largest of which was an 80,000-square-foot lease at 5101 Ashley Phosphate Road signed by an undisclosed tenant.
Sales
- Method Residential, LLC purchased the Historic Dixie Building located at 529 King Street for $11 million. Their redevelopment plans are to create second story residential living with first floor retail.
- Blatteis & Schnur, Inc. purchased 263 King Street for $5.38 million. It is an 8,321-square-foot retail storefront.
Gross Retail Sales & Employment
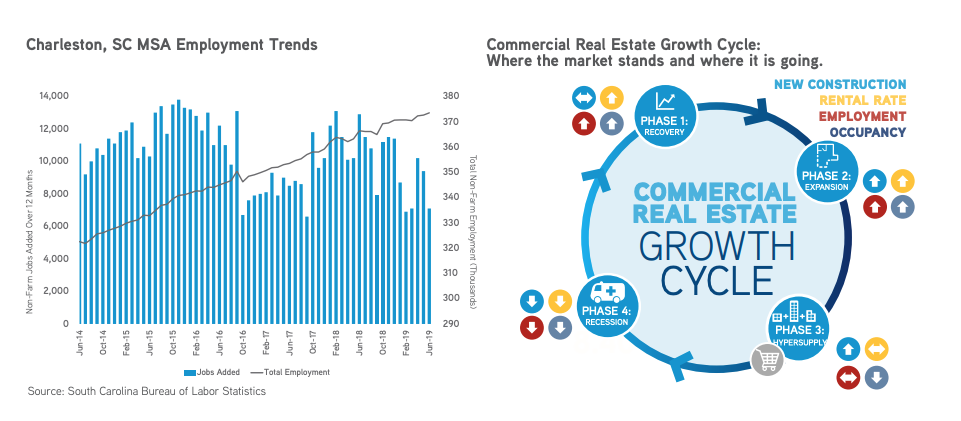
Per the Bureau of Labor Statistics’ most recent data through June 2019, non-farm employment reached 373,500 jobs and there were 7,100 new jobs added to the Charleston Metropolitan Statistical Area (MSA) within the last 12 months. Data from the South Carolina Department of Revenue stated gross retail sales in the Charleston MSA over the last twelve months reached $30.76 billion.
Market Forecast
Retail trends are ever-changing within the Charleston retail market. Going forward, big box retail and malls will change their retail make-up as gyms, furniture stores and other retailers needing showroom and equipment spaces absorb the empty space. Also, north King Street is becoming a trendy hotspot for local restaurants to thrive. Despite the negative absorption posted this quarter, the outlook remains positive for the Charleston retail market. However, as new construction delivers, the overall absorption may remain negative for a few more quarters. The suburbs have construction underway that is predicted to deliver before the end of this year. Charleston employment, tourism and population growth is positive, and will continue to draw new clients and customers to the region. The average rental rates will fluctuate but, due to the large range of prices retail owners can choose from, owners should be able to find a perfectly-suited location for their specific shop needs.
Around South Carolina
Columbia, SC
- During the second quarter of 2019, the overall quarterly market vacancy rate plunged from 10.51% to 9.65%, because the Columbia retail market absorbed 114,051 square feet. Columbia retail weighted rental rates across the submarkets range from $8.00 per square foot up to $24.58 per square foot.
Greenville-Spartanburg, SC
- The Greenville-Spartanburg market posted a net negative absorption of 269,909 square feet this quarter, largely due to non-core submarkets posting a net negative absorption of 253,688 square feet. Core retail shop spaces posted a net negative absorption of 16,221 square feet. The second quarter average shop space weighted rental rate dropped from $12.20 per square foot during the first quarter of this year to $10.14 per square foot during the second quarter of 2019; core shopping center weighted rents averaged $17.42 per square foot, while non-core weighted rents averaged $9.90 per square foot.
For additional commercial real estate news, check out our market reports here.